Tallenna
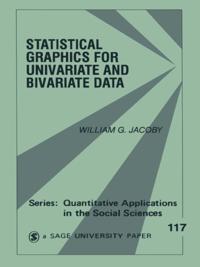
Statistical Graphics for Univariate and Bivariate Data
Lue Adobe DRM-yhteensopivassa e-kirjojen lukuohjelmassaTämä e-kirja on kopiosuojattu Adobe DRM:llä, mikä vaikuttaa siihen, millä alustalla voit lukea kirjaa. Lue lisää
Author William G. Jacoby focuses on graphical displays that researchers can employ as an integral part of the data analysis process. Such visual depictions are frequently more revealing than traditional, numerical summary statistics. Accessibly written, this book contains chapters on univariate and bivariate methods. The former covers histograms, smoothed histograms, univariate scatterplots, quantile plots, box plots, and dot plots. The latter covers scatterplot construction guidelines, jittering for overplotted points, marginal box plots, scatterplot slicing, the Loess procedure for nonparametric scatterplot smoothing, and banking to 45 degrees for enhanced visual perception. This book provides strategies for examining data more effectively. The resultant insights help researchers avoid the problem of forcing an inaccurate model onto uncooperative data and guide analysts to model specifications that provide accurate representations of empirical information.
- Kirjailija
- William G. Jacoby
- ISBN
- 9781452215044
- Kieli
- englanti
- Julkaisupäivä
- 24.2.1997
- Kustantaja
- Sage Publications
- Formaatti
- PDF - Adobe DRM
- Lue e-kirjoja täällä
- Lue e-kirja mobiililaitteella/tabletilla
- Lukulaite
- Tietokone